specplot#
Read a SPEC data file and plot a thumbnail image.
This code can be called as a standalone program or it can be imported into another program and called as a subroutine, as shown in the specplot_gallery program.
The standard representation of a SPEC scan is a line plot of the last data column versus the first data column. Any SPEC macro which name ends with scan ([1]) will be plotted as a line plot.
A special case SPEC scan macro is the hklscan where one of the three reciprocal space axes is scanned while the other two remain constant. A special handler (SPEC’s hklscan macro) is provided to pick properly the scanned axis (not always the first column) for representation as a line plot.
Some SPEC macros scan two positioners over a grid to collect a 2-D image one pixel at a time. These scans are represented as color-mapped images where the first two columns are the vertical and horizontal axes and the image is color-mapped to intensity. Any SPEC macro which name ends with mesh will be plotted as an image plot.
Different handling can be customized for scan macros, as described in How to write a custom scan handling class for specplot.
How to use specplot#
Plot a scan from one of the sample data files supplied with spec2nexus:
user@host ~$ specplot spec2nexus/data/APS_spec_data.dat 2 specplot.png
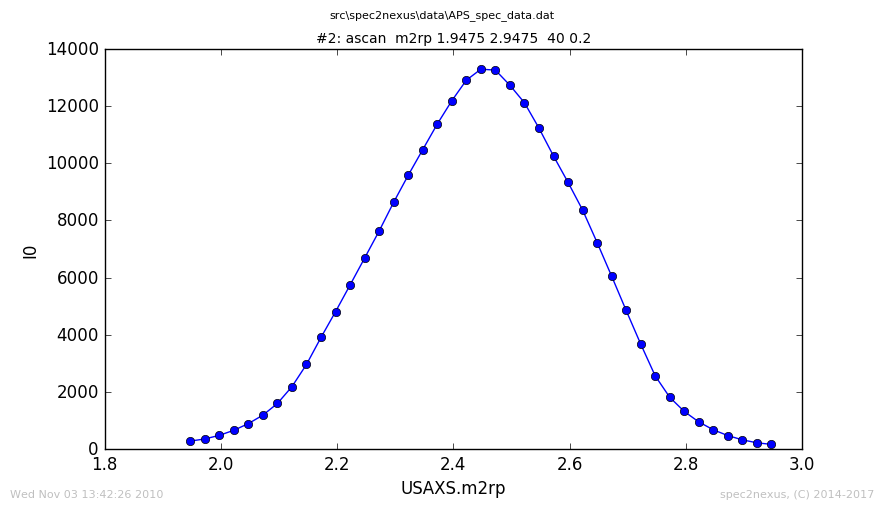
Plot of scan #2 from example data file APS_spec_data.dat.#
Usage#
user@host ~$ specplot
usage: specplot.py [-h] specFile scan_number plotFile
Help#
user@host ~$ specplot -h
usage: specplot.py [-h] specFile scan_number plotFile

read a SPEC data file and plot scan n

positional arguments:
  specFile     SPEC data file name
  scan_number  scan number in SPEC file
  plotFile     output plot file name

optional arguments:
  -h, --help   show this help message and exit
source code documentation#
Plot the data from scan N in a SPEC data file
|
associate SPEC scan macro names with image makers |
superclass to handle plotting of data from a SPEC scan |
|
create a line plot |
|
create a mesh plot (2-D image) |
|
|
convenience routine so that others do not have to import spec2nexus.spec |
Exceptions:
No data found. |
|
No plottable data for this scan. |
|
Scan aborted before all points acquired. |
|
Incorrect Python object type: programmer error. |
- class spec2nexus.specplot.HKLScanPlotter[source]#
Bases:
LinePlottercreate a line plot from hklscan macros
- _initialize_settings_()#
initial values are set to None
subclasses that set a value should first check if the value has already been set unless explicitly replacing any customizations by the user
- data_file_name()#
the name of the file with the actual data
Usually, this is the SPEC data file but it could be something else
- data_is_newer_than_plot(plotFile)#
only proceed if mtime of SPEC data file is newer than plotFile
- make_image(plotFile)#
make MatPlotLib chart image from the SPEC scan
- Parameters:
plotFile (str) – name of image file to write
- plot_options()#
define the settings for this, accepting any non-default values first
- plot_scan(scan, plotFile, maker=None)#
make an image plot of the data in the scan
- Parameters:
scan (obj) – instance of
SpecDataFileScanplotFile (str) – file name for plot output
- plot_subtitle()#
Return the plot_subtitle.
- plot_title()#
Return the plot title.
- plottable()#
can this data be plotted as expected?
- set_plot_subtitle(text)#
Set the plot_subtitle.
- set_plot_title(text)#
Set the plot title.
- set_timestamp(text)#
Set the plot time stamp.
- set_x_log(choice)#
Set the x axis logarithmic if True.
- set_x_title(text)#
Set the x axis title.
- set_y_log(choice)#
Set the y axis logarithmic if True.
- set_y_title(text)#
Set the y axis title.
- set_z_log(choice)#
Set the z axis (image) logarithmic if True.
- timestamp()#
Return the time of this scan as a string.
- x_log()#
Boolean: should the X axis be plotted on a log scale?
- x_title()#
Return the title for the X axis.
- y_log()#
Boolean: should the Y axis be plotted on a log scale?
- y_title()#
Return the title for the Y axis.
- z_log()#
Boolean: should the Z axis (image) be plotted on a log scale?
- class spec2nexus.specplot.ImageMaker[source]#
Bases:
objectsuperclass to handle plotting of data from a SPEC scan
Internal data model
- Signal:
name of the
signaldata (default data to be plotted)- Data:
values of various collected arrays {label: array}
- Axes:
names of the axes of signal data
USAGE:
Create a subclass of
ImageMakerOverride any of these methods:
the name of the file with the actual data
make_image(plotFile)make MatPlotLib chart image from the SPEC scan
can this data be plotted as expected?
re-define any plot options in a subclass
retrieve default plottable data from spec data file and store locally
EXAMPLE
class LinePlotter(ImageMaker):
    '''create a line plot'''

    def make_image(self, plotFile):
        '''
        make MatPlotLib chart image from the SPEC scan

        :param obj plotData: object returned from :meth:`retrieve_plot_data`
        :param str plotFile: name of image file to write
        '''
        assert(self.signal in self.data)
        assert(len(self.axes) == 1)
        assert(self.axes[0] in self.data)

        y = self.data[self.signal]
        x = self.data[self.axes[0]]
        xy_plot(x, y,  plotFile,
               title = self.plot_title(),
               plot_subtitle = self.plot_subtitle(),
               xtitle = self.x_title(),
               ytitle = self.y_title(),
               xlog = self.x_log(),
               ylog = self.y_log(),
               timestamp_str = self.timestamp())

sfile = specplot.openSpecFile(specFile)
scan = sfile.getScan(scan_number)
plotter = LinePlotter()
plotter.plot_scan(scan, plotFile, y_log=True)
- _initialize_settings_()[source]#
initial values are set to None
subclasses that set a value should first check if the value has already been set unless explicitly replacing any customizations by the user
- data_file_name()[source]#
the name of the file with the actual data
Usually, this is the SPEC data file but it could be something else
- data_is_newer_than_plot(plotFile)[source]#
only proceed if mtime of SPEC data file is newer than plotFile
- make_image(plotFile)[source]#
make MatPlotLib chart image from the SPEC scan
The data to be plotted are provided in:
self.signal
self.axes
self.data
- Parameters:
plotFile (str) – name of image file to write
- plot_scan(scan, plotFile, maker=None)[source]#
make an image plot of the data in the scan
- Parameters:
scan (obj) – instance of
SpecDataFileScanplotFile (str) – file name for plot output
- retrieve_plot_data()[source]#
retrieve default plottable data from spec data file and store locally
This method must retrieve the data to be plotted, either from the SPEC data file scan or from a file which name is provided in the scan detalis.
These attributes must be set by this method:
- Data:
dictionary containing values of the various collected arrays {label: array}
- Signal:
name of the ‘signal’ data (default data to be plotted)
- Axes:
names of the axes of signal data
Example data
self.data = {
    'angle': [1, 2, 3, 4, 5],
    'counts': [0. 2. 55. 3. 0]}
self.signal = 'counts'
self.axes = ['angle']
Raise any of these exceptions as appropriate:
No data found.
No plottable data for this scan.
Scan aborted before all points acquired.
- class spec2nexus.specplot.LinePlotter[source]#
Bases:
ImageMakercreate a line plot
- _initialize_settings_()#
initial values are set to None
subclasses that set a value should first check if the value has already been set unless explicitly replacing any customizations by the user
- data_file_name()#
the name of the file with the actual data
Usually, this is the SPEC data file but it could be something else
- data_is_newer_than_plot(plotFile)#
only proceed if mtime of SPEC data file is newer than plotFile
- make_image(plotFile)[source]#
make MatPlotLib chart image from the SPEC scan
- Parameters:
plotFile (str) – name of image file to write
- plot_scan(scan, plotFile, maker=None)#
make an image plot of the data in the scan
- Parameters:
scan (obj) – instance of
SpecDataFileScanplotFile (str) – file name for plot output
- plot_subtitle()#
Return the plot_subtitle.
- plot_title()#
Return the plot title.
- set_plot_subtitle(text)#
Set the plot_subtitle.
- set_plot_title(text)#
Set the plot title.
- set_timestamp(text)#
Set the plot time stamp.
- set_x_log(choice)#
Set the x axis logarithmic if True.
- set_x_title(text)#
Set the x axis title.
- set_y_log(choice)#
Set the y axis logarithmic if True.
- set_y_title(text)#
Set the y axis title.
- set_z_log(choice)#
Set the z axis (image) logarithmic if True.
- timestamp()#
Return the time of this scan as a string.
- x_log()#
Boolean: should the X axis be plotted on a log scale?
- x_title()#
Return the title for the X axis.
- y_log()#
Boolean: should the Y axis be plotted on a log scale?
- y_title()#
Return the title for the Y axis.
- z_log()#
Boolean: should the Z axis (image) be plotted on a log scale?
- class spec2nexus.specplot.MeshPlotter[source]#
Bases:
ImageMakercreate a mesh plot (2-D image)
..rubric:: References:
- Mesh 2-D parser:
https://www.certif.com/spec_help/mesh.html
mesh motor1 start1 end1 intervals1 motor2 start2 end2 intervals2 time
- Hklmesh 2-D parser:
https://www.certif.com/spec_help/hklmesh.html
hklmesh Q1 start1 end1 intervals1 Q2 start2 end2 intervals2 time
- _initialize_settings_()#
initial values are set to None
subclasses that set a value should first check if the value has already been set unless explicitly replacing any customizations by the user
- data_file_name()#
the name of the file with the actual data
Usually, this is the SPEC data file but it could be something else
- data_is_newer_than_plot(plotFile)#
only proceed if mtime of SPEC data file is newer than plotFile
- make_image(plotFile)[source]#
make MatPlotLib chart image from the SPEC scan
- Parameters:
plotFile (str) – name of image file to write
- plot_scan(scan, plotFile, maker=None)#
make an image plot of the data in the scan
- Parameters:
scan (obj) – instance of
SpecDataFileScanplotFile (str) – file name for plot output
- plot_subtitle()#
Return the plot_subtitle.
- plot_title()#
Return the plot title.
- retrieve_plot_data()[source]#
retrieve default data from spec data file
data parser for 2-D mesh and hklmesh
- set_plot_subtitle(text)#
Set the plot_subtitle.
- set_plot_title(text)#
Set the plot title.
- set_timestamp(text)#
Set the plot time stamp.
- set_x_log(choice)#
Set the x axis logarithmic if True.
- set_x_title(text)#
Set the x axis title.
- set_y_log(choice)#
Set the y axis logarithmic if True.
- set_y_title(text)#
Set the y axis title.
- set_z_log(choice)#
Set the z axis (image) logarithmic if True.
- timestamp()#
Return the time of this scan as a string.
- x_log()#
Boolean: should the X axis be plotted on a log scale?
- x_title()#
Return the title for the X axis.
- y_log()#
Boolean: should the Y axis be plotted on a log scale?
- y_title()#
Return the title for the Y axis.
- z_log()#
Boolean: should the Z axis (image) be plotted on a log scale?
- exception spec2nexus.specplot.NoDataToPlot[source]#
Bases:
ValueErrorNo data found.
- add_note()#
Exception.add_note(note) – add a note to the exception
- args#
- with_traceback()#
Exception.with_traceback(tb) – set self.__traceback__ to tb and return self.
- exception spec2nexus.specplot.NotPlottable[source]#
Bases:
ValueErrorNo plottable data for this scan.
- add_note()#
Exception.add_note(note) – add a note to the exception
- args#
- with_traceback()#
Exception.with_traceback(tb) – set self.__traceback__ to tb and return self.
- exception spec2nexus.specplot.ScanAborted[source]#
Bases:
RuntimeWarningScan aborted before all points acquired.
- add_note()#
Exception.add_note(note) – add a note to the exception
- args#
- with_traceback()#
Exception.with_traceback(tb) – set self.__traceback__ to tb and return self.
- class spec2nexus.specplot.Selector(*args, **kwargs)[source]#
Bases:
Singletonassociate SPEC scan macro names with image makers
- Image maker:
subclass of
ImageMaker
To include a custom image maker from outside this module, create the subclass and then add it to an instance of this class. Such as this plotter that defaults to a logarithmic scale for the X axis for all logxscan macros:
from spec2nexus import specplot
class LogX_Plotter(specplot.ImageMaker):
- def x_log(self):
return True
# …
selector = specplot.Selector() selector.add(‘logxscan’, LogX_Plotter)
# …
image_maker = specplot.Selector().auto(scan) plotter = image_maker() plotter.plot_scan(scan, fullPlotFile)
This class is a singleton which means you will always get the same instance when you call this class many times in your program.
auto(scan)automatically choose a scan image maker based on the SPEC scan macro
add(key, value[, default])register a new value by key
update(key, value[, default])replace an existing key with a new value
get(key)return a value by key
exists(key)is the key known?
default()retrieve the value of the default key
- add(key, value, default=False)[source]#
register a new value by key
- Parameters:
key (str) – name of key, typically the macro name
- Raises:
KeyError – if key exists
UnexpectedObjectTypeError – if value is not subclass of
ImageMaker
- auto(scan)[source]#
automatically choose a scan image maker based on the SPEC scan macro
Selection Rules:
macro ends with “scan”: use
LinePlottermacro ends with “mesh”: use
MeshPlotterdefault: use default image maker (initially
LinePlotter)
- default_key = '__default__'#
- get(key)[source]#
return a value by key
- Returns:
subclass of
ImageMakeror None if key not found
- update(key, value, default=False)[source]#
replace an existing key with a new value
- Parameters:
key (str) – name of key, typically the macro name
- Raises:
KeyError – if key does not exist
UnexpectedObjectTypeError – if value is not subclass of
ImageMaker
- exception spec2nexus.specplot.UnexpectedObjectTypeError[source]#
Bases:
RuntimeErrorIncorrect Python object type: programmer error.
- add_note()#
Exception.add_note(note) – add a note to the exception
- args#
- with_traceback()#
Exception.with_traceback(tb) – set self.__traceback__ to tb and return self.